Announcement

Collapse
No announcement yet.

Corona - PLEASE READ

Collapse
X
 
  • Filter
  • Time
  • Show
Clear All
new posts

    #61
    Originally posted by LWC View Post
    https://covid19.healthdata.org/projections

    Drastically different projections from a different modeler. If someone wants to post the model images we can compare and see if they are closer than Dr. Frank. I hope they are not.

    Has Dr Frank updated his model? ...or did it not trend correctly m and he ditched it?


    Sent from my iPad using Tapatalk
    Comment


      #62
      Originally posted by txpitdog View Post
      Has Dr Frank updated his model? ...or did it not trend correctly m and he ditched it?


      Sent from my iPad using Tapatalk
      Still updated daily if not more here https://www.facebook.com/groups/158015618707622/

      The latest projection I saw was about 6,000 US Deaths. As more data comes out this will likely change again. It is not totally unlike a weather forecast. Where on Sunday it shows a 80% chance of rain for Friday. Well by Wednesday the rain chance for Friday may have dropped to 20%. That is a big difference. But that is just the weather man using the most current data they have to try and forecast what will happen in the future. Much the same with Dr. Frank. His models are a forecast using the most current data. Not perfect and changing daily.

      For perspective, The imperial College of London (who's model many governments used to set their corona policy) as late as March 17th estimated the US would have 1.1 Million Deaths, even if we used more ambitious mitigation (social distancing) measures. It is still yet to be seen which model will end up closer. For everyone's sake I sure hope it is the lower one.

      I'm still looking for more models. If anyone has any different ones that are current and regularly updated, please post.

      Comment


        #63
        Originally posted by SaltwaterSlick View Post
        As soon as the media can no longer keep it hyped up because people are getting well and fewer are dying, it will all fizzle out... It'd be turning down now but for the sensationalizing of the MSM trying to find something to make a headline out of or NEWS ALERT, BREAKING NEWS, BREAKING NOW bs...
        I agree. I'm seriously 50/50 on what the Democraps will do in a month or two. They will either flip and say Trump over reacted big time and screwed everyone.. Or stick to their guns and say he caused every death. But this 2nd option will be harder to do IMO once this starts getting downplayed. I guess they could ride the middle and say..See social distancing worked, why didn't Trump do it sooner...That was a Dem idea and saved us all!


        Originally posted by LWC View Post
        https://covid19.healthdata.org/projections

        Drastically different projections from a different modeler. If someone wants to post the model images we can compare and see if they are closer than Dr. Frank. I hope they are not.
        Ignore if you're tired of seeing me post this.. Or prove me wrong (I'd like to see data that proves me wrong).

        Seems like all the data everyone's using is either deaths or confirmed number of infected. This completely makes their charts all wrong. Most people know we had many infected in Feb. possibly thousands or more in Jan. But since there was no testing the data is left out.

        I have not kept up with these charts and models FTR Just giving my opinion that's frustrated me from day one.

        One could argue the chart would be the same AFTER recent and only change going backward. I guess.

        Comment


          #64


          Looks like Covid is actually saving lives. Well at least while everyone is sitting at home.

          Comment


            #65


            Projecting the Diamond Princess mortality rate onto the age structure of the U.S. population, the death rate among people infected with Covid-19 would be 0.125%. But since this estimate is based on extremely thin data — there were just seven deaths among the 700 infected passengers and crew — the real death rate could stretch from five times lower (0.025%) to five times higher (0.625%). It is also possible that some of the passengers who were infected might die later, and that tourists may have different frequencies of chronic diseases — a risk factor for worse outcomes with SARS-CoV-2 infection — than the general population. Adding these extra sources of uncertainty, reasonable estimates for the case fatality ratio in the general U.S. population vary from 0.05% to 1%.

            Comment


              #66
              Saw on his FB page that he is claiming we’re at peak. I don’t think we are here in Texas, but hopefully somewhere they are. Saw that Italy had its second straight day of declining daily death rate. Maybe the glimmers of good news will start trickling in, though I s will go on for at least another few weeks.


              Sent from my iPad using Tapatalk

              Comment


                #67
                Originally posted by RiverRat1 View Post


                Looks like Covid is actually saving lives. Well at least while everyone is sitting at home.
                Source?

                Comment


                  #68
                  Corona - PLEASE READ

                  Originally posted by LWC View Post
                  https://covid19.healthdata.org/projections

                  Drastically different projections from a different modeler. If someone wants to post the model images we can compare and see if they are closer than Dr. Frank. I hope they are not.

                  Very interesting change this morning. As of last night, peak for Texas was projected to be April 18th. This morning the model removed the “non-essential services closed” variable, and it shifted peak back to May 2nd. I’ve not looked at the other states yet, but I wonder if this was due to Texans largely ignoring stat at home orders. It also reduced the projected intensity for hospital and ICU needs.


                  Sent from my iPad using Tapatalk

                  Comment


                    #69
                    Originally posted by txpitdog View Post
                    Very interesting change this morning. As of last night, peak for Texas was projected to be April 18th. This morning the model removed the “non-essential services closed” variable, and it shifted peak back to May 2nd. I’ve not looked at the other states yet, but I wonder if this was due to Texans largely ignoring stat at home orders. It also reduced the projected intensity for hospital and ICU needs.
                    Where did you see this? The last update I saw for Texas was yesterday and it showed a peek on the 27th which aligned with the original prediction of the 26th or 27th. The actual numbers are significantly higher (looking at total deaths).

                    Edit: I was looking at Dr. Franks models. You may be referring to something else.

                    Comment


                      #70
                      Originally posted by Rush2Judge View Post
                      Where did you see this? The last update I saw for Texas was yesterday and it showed a peek on the 27th which aligned with the original prediction of the 26th or 27th. The actual numbers are significantly higher (looking at total deaths).

                      Edit: I was looking at Dr. Franks models. You may be referring to something else.

                      This: https://covid19.healthdata.org/projections


                      Sent from my iPad using Tapatalk

                      Comment


                        #71
                        First Global death drop seen today. 3,521 deaths on Mar28 and 3,204 on Mar29. Something to watch to see if a trend.

                        Updated total and statistics, graphs and charts tracking the total number of deaths, deaths per day, and death by country from the Novel Coronavirus (2019-nCoV) originating from Wuhan, China

                        Comment


                          #72
                          Originally posted by LWC View Post
                          First Global death drop seen today. 3,521 deaths on Mar28 and 3,204 on Mar29. Something to watch to see if a trend.

                          https://www.worldometers.info/corona...us-death-toll/

                          Mmm...not the first. Scroll to the bottom. There are a number of days where the following day had a reduced death rate. Need that to string together to form a trend. Will be interesting to see how the week develops.


                          Sent from my iPad using Tapatalk

                          Comment


                            #73
                            Originally posted by txpitdog View Post
                            Mmm...not the first. Scroll to the bottom. There are a number of days where the following day had a reduced death rate. Need that to string together to form a trend. Will be interesting to see how the week develops.


                            Sent from my iPad using Tapatalk
                            True. I should have said first significant drop. There are a couple little blips in there but nothing really of note.

                            Comment


                              #74
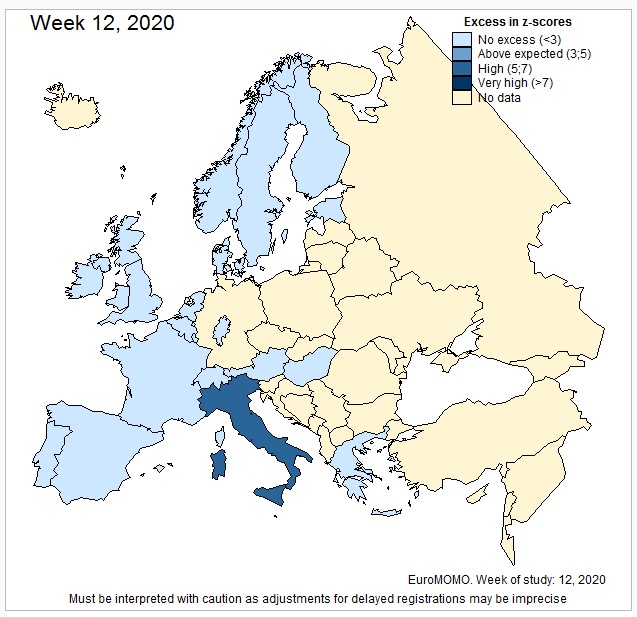
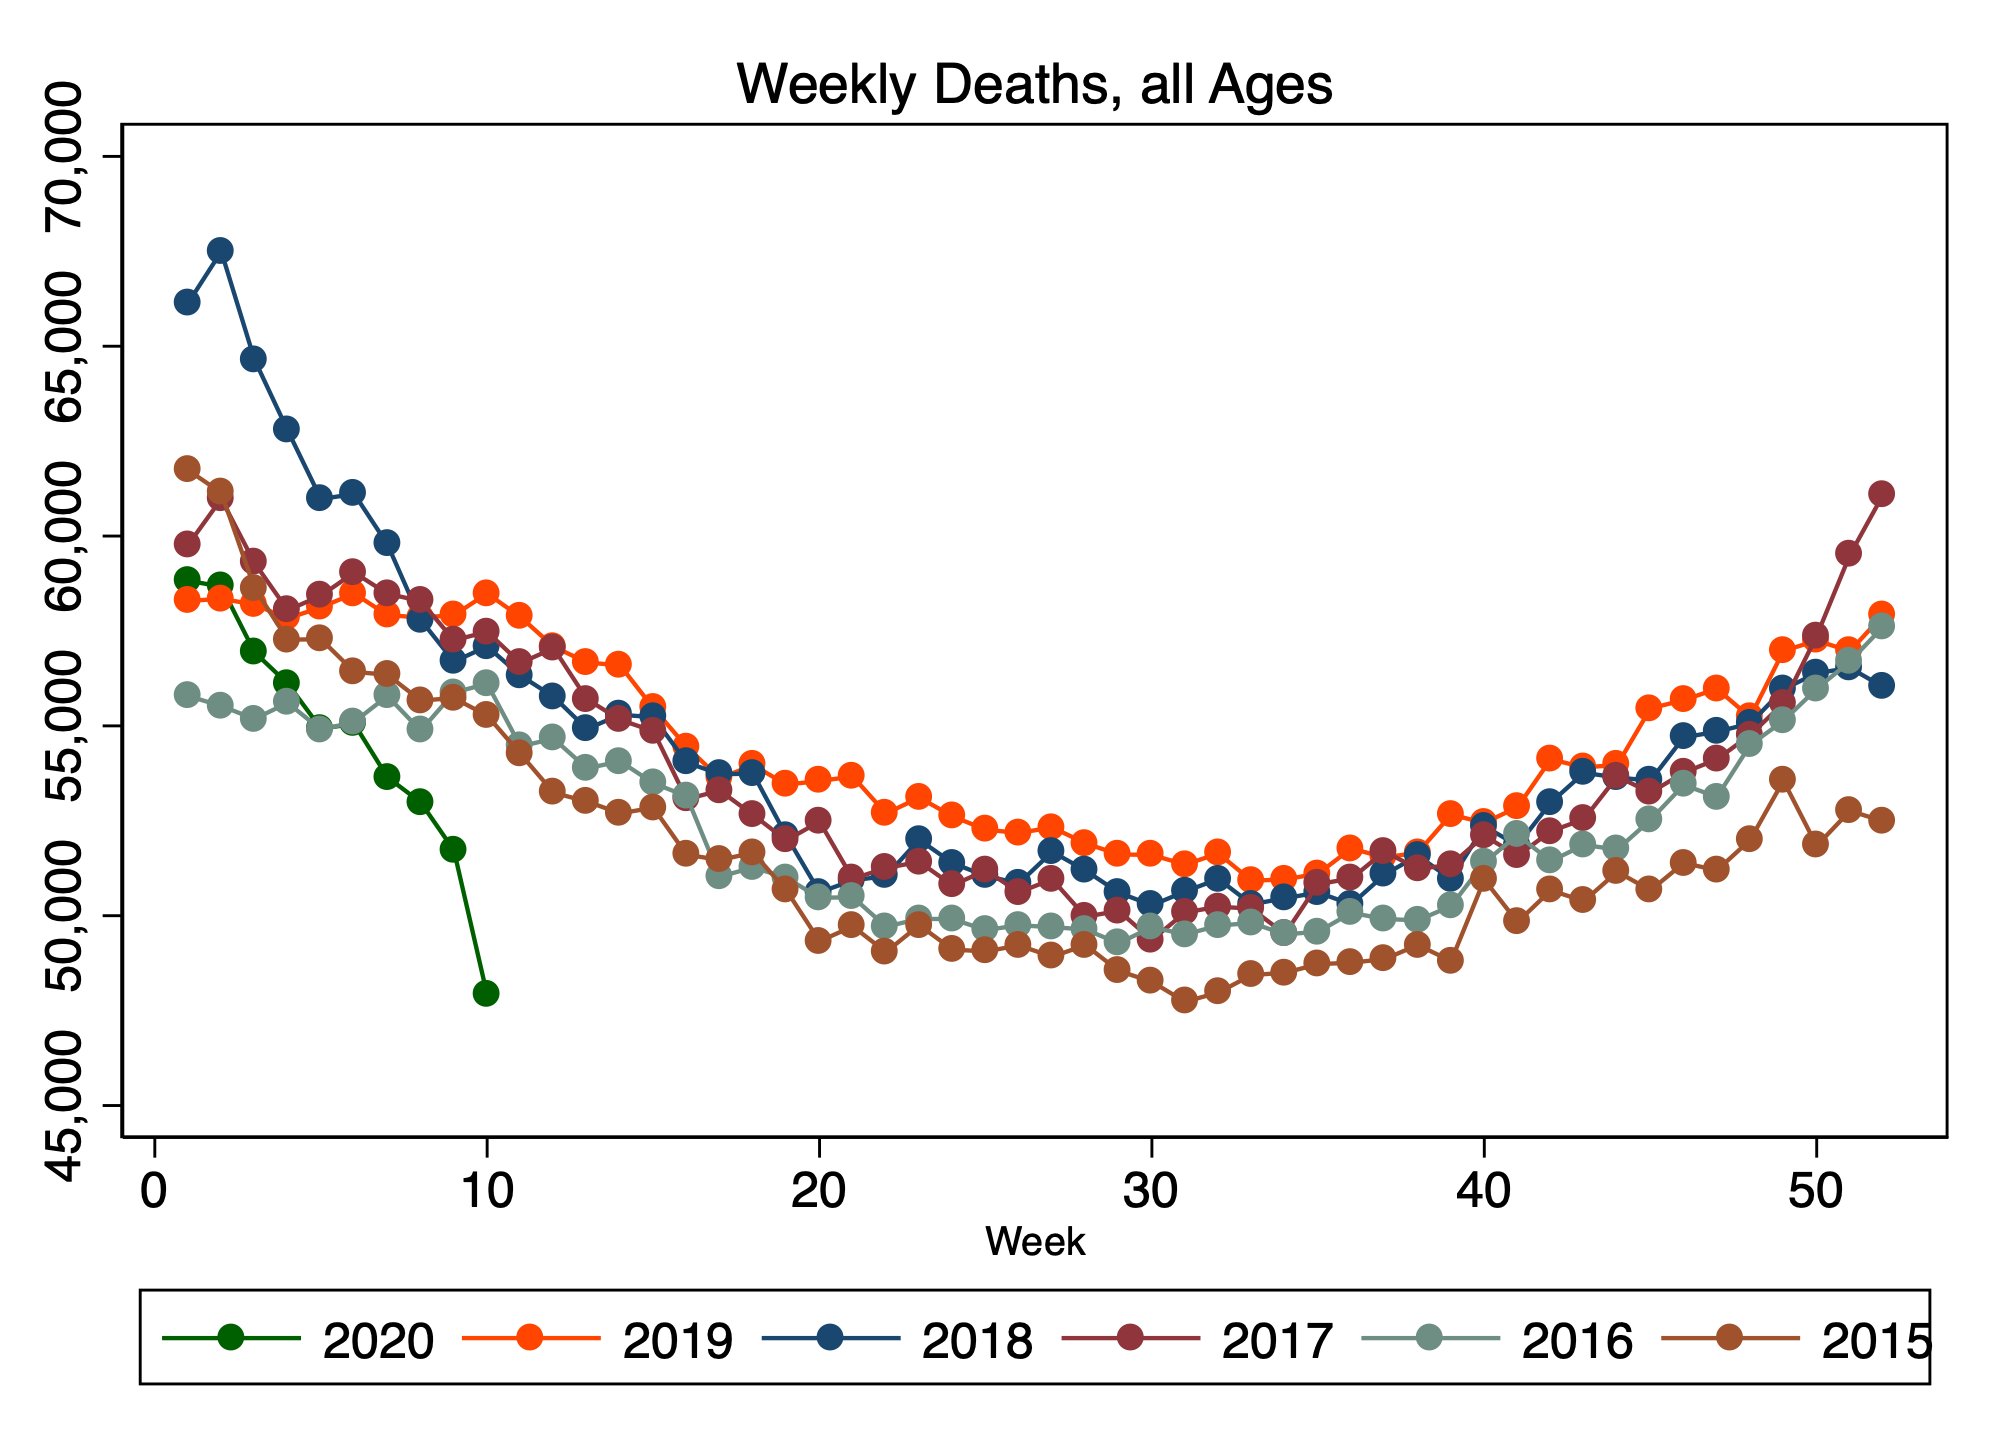
                              Check this out

                              The official figures for 24 countries across Europe show, not only that overall mortality is not increasing, but – so far – it is actually well below recent averages. The statistics wer…


                              The official figures for 24 countries across Europe show, not only that overall mortality is not increasing, but – so far – it is actually well below recent averages.

                              The article source may not be the most trustworthy but very interesting if true. So please take with a grain of salt.
                              They do show the source for their data which seems to corroborate the conclusions.


                              History
                              The overall objective of the original European Mortality Monitoring Project was to design a routine public health mortality monitoring system aimed at detecting and measuring, on a real-time basis, excess number of deaths related to influenza and other possible public health threats across participating European Countries.
                              Since 2009 the system has been in operation and is continuously being applied in countries that meet the minimal requirements.

                              Comment


                                #75
                                Originally posted by txpitdog View Post
                                Very interesting change this morning. As of last night, peak for Texas was projected to be April 18th. This morning the model removed the “non-essential services closed” variable, and it shifted peak back to May 2nd. I’ve not looked at the other states yet, but I wonder if this was due to Texans largely ignoring stat at home orders. It also reduced the projected intensity for hospital and ICU needs.


                                Sent from my iPad using Tapatalk

                                Originally posted by txpitdog View Post
                                This: https://covid19.healthdata.org/projections


                                Sent from my iPad using Tapatalk

                                This model’s peak shifted back again this morning, now at May 6 and beginning to show an increasing trend in the shortage of hospital beds for the first time.


                                Sent from my iPad using Tapatalk

                                Comment

                                Working...
                                X